Dashboard
In brief: the dashboard is your start page in BauMaster. Directly after signing in you see all open tasks, record entries and news at a glance. The content is split into individual windows — widgets — which you can show, hide, arrange and filter per device.
Prerequisite: the full dashboard with all widgets is available to Smart and Expert users. Viewers and Teamworkers (free licences) see the same reduced view with the same widgets and, in the dashboard, their own tasks as well as tasks assigned to the whole project team.
What you use the dashboard for
The dashboard bundles the most important information from your projects in one place. As soon as you sign in to BauMaster you land here automatically.
You use the dashboard to
- keep an eye on open and overdue tasks,
- follow the status of your record entries,
- quickly reopen recently used records, and
- see current news about updates or training.
For deeper, cross-project and cross-record evaluations use Search & filters.
Structure and components
The dashboard consists of three areas:
- Menu bar — icons for all functions that otherwise sit in the expanded burger menu.
- Filter column — the grey box on the left where you filter the view and set the widget display. At the top of the filter column you see your company logo, the current calendar week with date, and the paint roller for the dashboard view.
- Widget area — all activated widgets, for example “my tasks”, “task companies” or “reporting”.
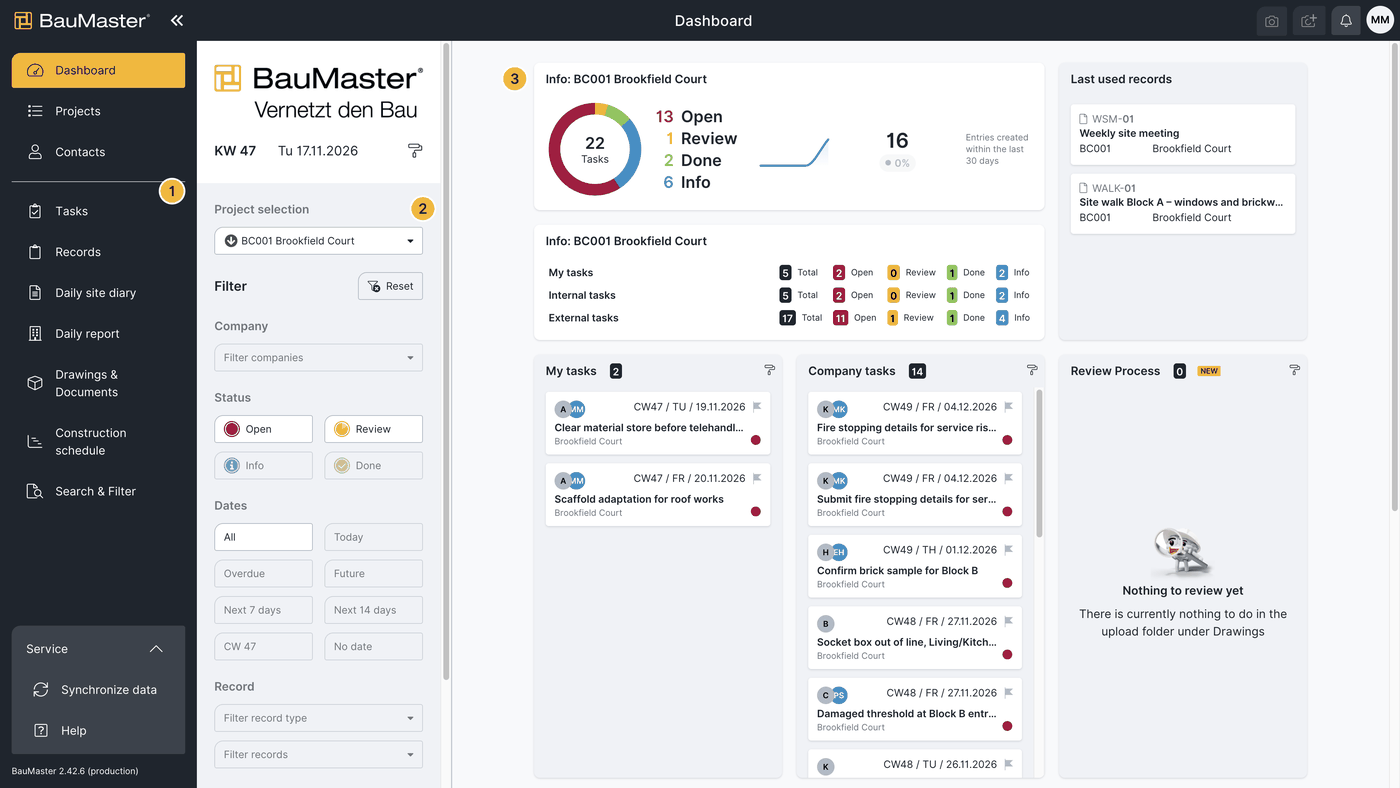
Available widgets include: reporting, task overview, my tasks, task companies, tasks overdue, recently used records, date, company logo and review process. The reporting widget gives an overview of open tasks and shows a round task circle.
For Viewers and Teamworkers the view is the same and reduced: they see reporting, my tasks, date, company logo, recently used records and news.
Set the widget display
You define which widgets are shown and in which order in the dashboard view. Click the paint roller at the top right of the filter column.
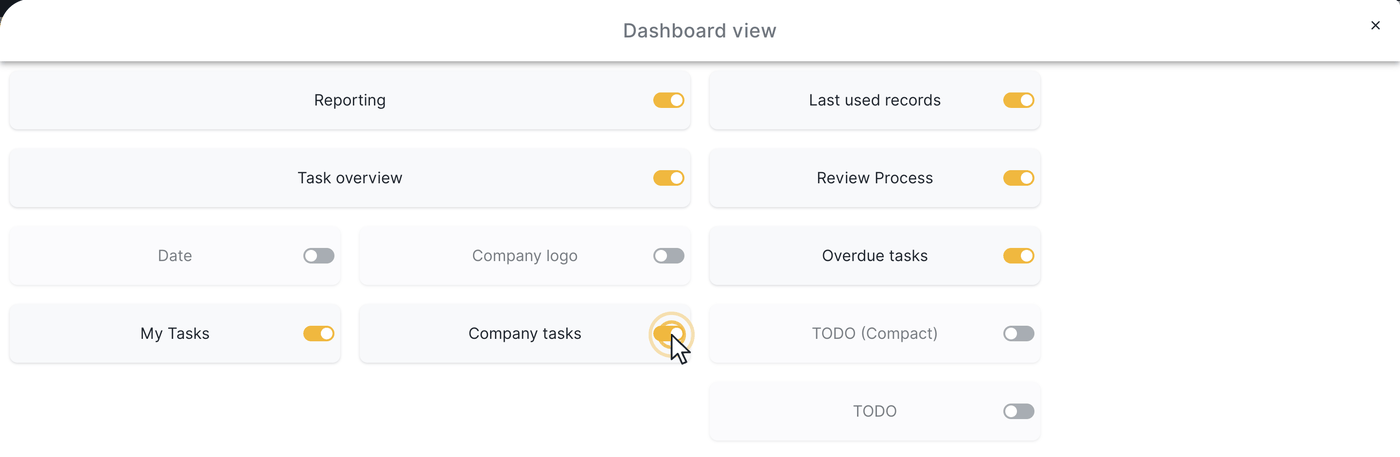
Note: all settings apply per device. That keeps the view more compact on a smartphone than on a tablet or PC.
Show and hide widgets
In the dashboard settings click the slider of the respective widget. An active slider shows the widget, a grey slider hides it. That way you can show only “my tasks” and “tasks overdue” on a smartphone and hide everything else.
Change the order of widgets
Drag a widget to the position you want: click it, hold the mouse button and move. The order can also be set per device. Exception: reporting and task overview are fixed and cannot be moved.
Settings of the task widgets
The widgets my tasks, task companies, tasks overdue and review process have their own views. Click the paint roller at the top right of the respective widget. There you define:
- Widget size: small, standard or large (affects the height only).
- Sort by: “to be done by” or “created on”.
- Sorting: ascending or descending.
Additionally you show or hide individual detail information per task: project, company and entry number.
Reporting, task overview, news, company logo, date and recently used records have no settings of their own.
Filter the dashboard
In the filter column you define which entries are shown in the dashboard. The filters affect all widgets — with two exceptions: reporting and task overview react only to the project filter, so that you always keep an overall picture.
Projects
Define which project you are working on and which projects are shown. Under switch project you choose the active project, under show further projects the additionally shown projects. By default the project created first is active.
Company
Show only tasks of specific companies. Click select company and choose the companies you want. By default all companies are active.
Status
Filter by the status of record entries. Depending on the record type, different statuses are available. By default the dashboard shows only entries with the status “open”.
Date
Show the dashboard for a specific period:
- All — the whole period (default)
- Today
- 7 days / 14 days — into the future
- Overdue — all overdue tasks
- Future — all future entries
- Week XY — by calendar week
- Without date — entries without a date
Record
Show only entries from specific records or record styles. By default all records of all styles from all projects are active.
Priority
Filter by the stored priority, for example only entries with the highest priority. By default no priority filter is set — entries with and without priority are shown.
Limitations
- Reporting and task overview are fixed in their position and cannot be moved.
- Both widgets react only to the project filter, not to the other filters.
- For detailed, cross-project evaluations, further filters (by trade, for example) or PDF export use Search & filters.
FAQ
Why don't I see all tasks in the dashboard?
By default only entries with the status “open” are shown. Adjust the status filter to see further entries.
Why does my filter not affect reporting or the task overview?
These two widgets deliberately react only to the project filter so that you always keep an overall picture.
Can I set the dashboard differently per device?
Yes. Widget selection and order apply per device — more compact on a smartphone, more detailed on a PC.
How do I show overdue tasks?
Set the date filter to “overdue” or show the “tasks overdue” widget.
Keywords: dashboard